An Experiment in Listening to the Neighborhood
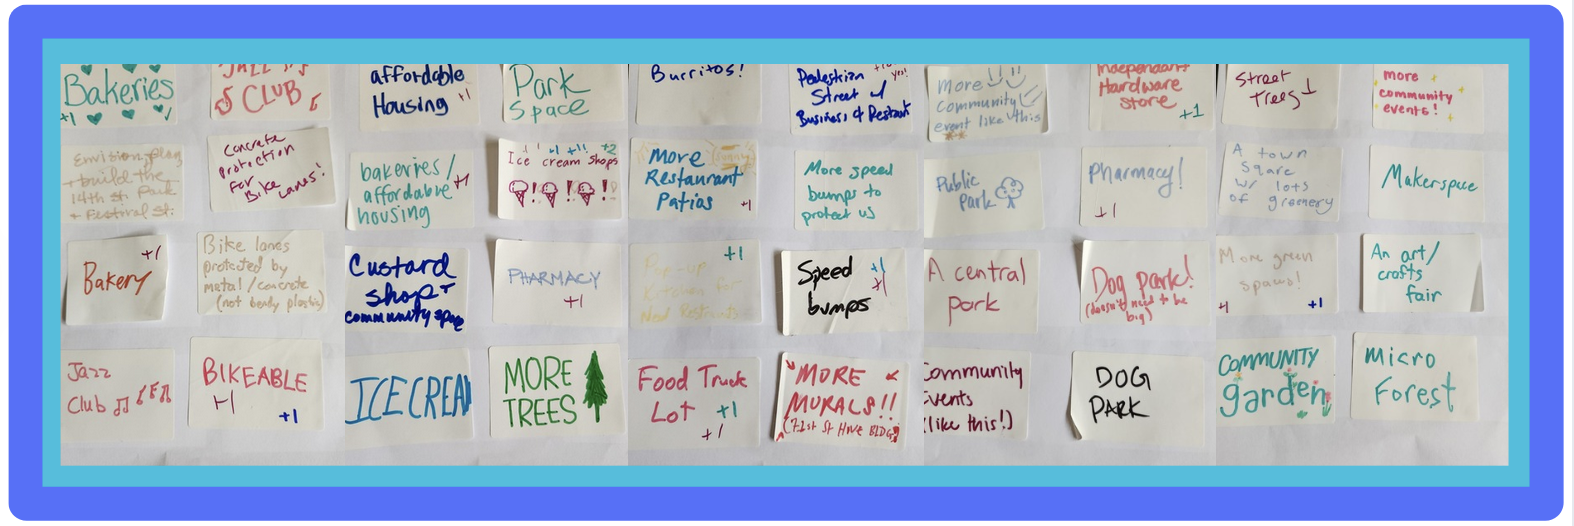
Last month, over a thousand people attended the Rooted in Roosevelt festival, and several dozen of them participated in an idea board. Participants used sticky notes to share their thoughts on what Roosevelt needs, including capping the Roosevelt Reservoir, a dog cafe, a micro-forest, and even a neighborhood Taco Time. We then loaded 51 of these ideas into a survey tool called Polis and sent them to the Roosevelt Neighborhood Association’s 600-plus person email list, asking neighbors to agree or disagree, and even add their own additional ideas into the mix.
Survey Results:
The greatest consensus was around the following five needs:
- A neighborhood bakery
- A neighborhood pharmacy
- Community events
- Public art
- Community spaces
A next tier of shared interests included:
- A pedestrian-only street for shopping and dining
- Turning the Roosevelt Reservoir into a park
- More affordable housing
- More trash bins on Roosevelt Way
- More trees
Grassroots Listening
Polis is not a survey tool for generating statistically meaningful results. Its open-ended approach to survey participation introduces something called response bias. So when Polis tells us that 83% of respondents agreed that Roosevelt needs a bakery, those findings are not projectable to the neighborhood as a whole. So, why did we use it?
Think of Polis as a tool for open-ended listening. It’s great for exploring patterns in community sentiment and surfacing ideas that might otherwise not be heard. For example, the Roosevelt Neighborhood Association would never have thought to ask about a neighborhood Sichuan restaurant. But one of your neighbors did, and about a third of survey respondents agreed. Does that mean Roosevelt has a huge demand for dan dan noodles? Not necessarily, but it does suggest it might be worth some restauranteer’s exploring.
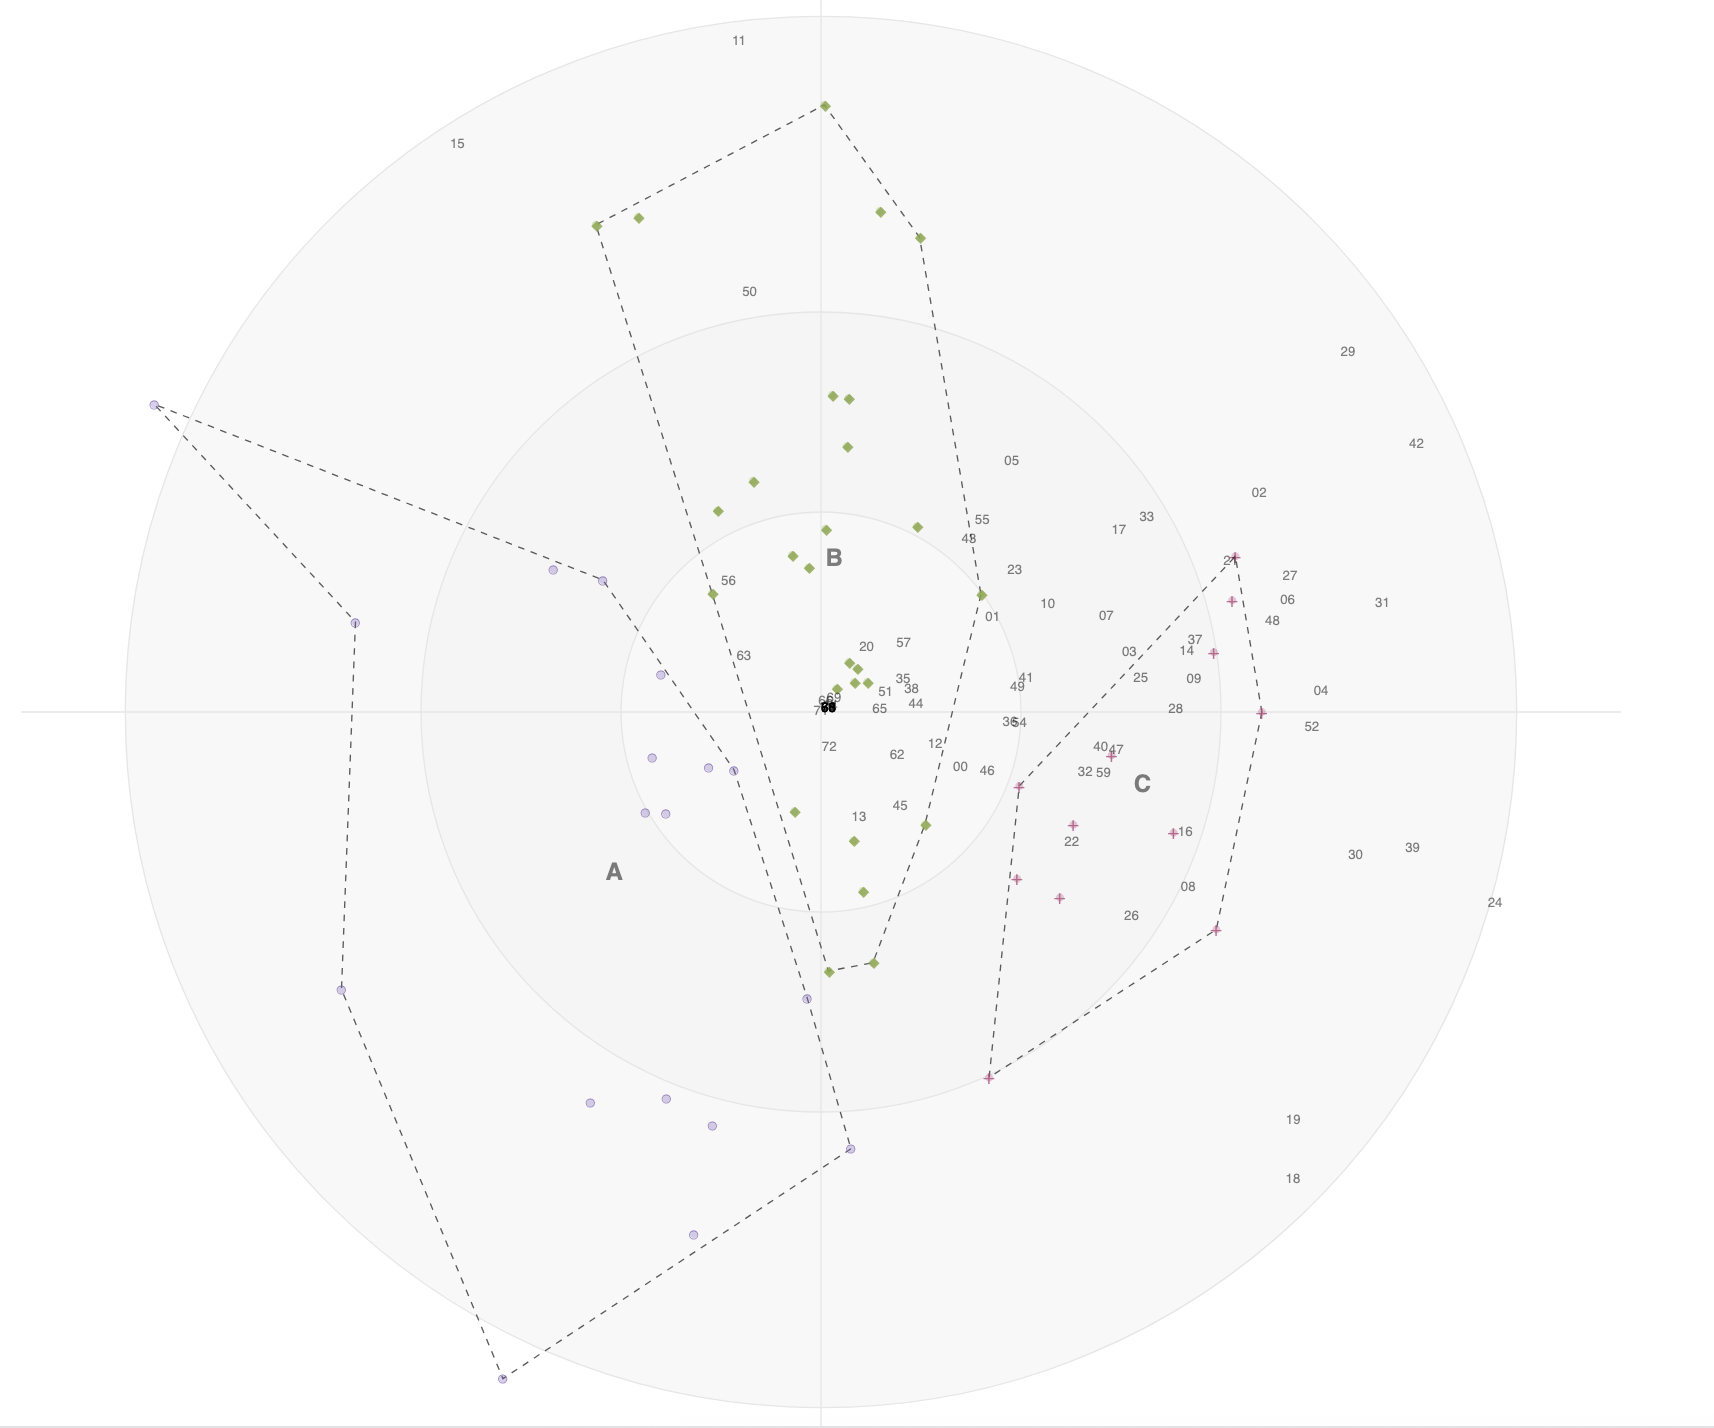
Neighborhood Opinion Groups
One of the other things that Polis is good for is clustering responses into something called opinion groups. As survey results started flowing in, these opinion groups fluxed by the hour, so I’m cautious about reading too much into them based on just 77 responses. With that said, there are some interesting patterns worth noting.
Polis doesn’t label the opinion groups, so it’s up to us to interpret them based on patterns in the responses. In our survey, “Group A” tended to disagree more frequently than the other two clusters. They had relatively strong negative responses to ideas like a farmers market, a food truck lot, a jazz club, 10+ story buildings, and more commercial space. In contrast, “Group C” agreed with almost everything aside from more parking and increased security. The were also three times more likely to want a Taco Time and a Chilis. “Group B” was somewhere in the middle, but cared less about biking and was more open to increased security and parking (including free parking).
Why should we care about opinion groups in Roosevelt? Because it’s important to bear in mind that not all of your neighbors see the world exactly as you do. Surveys like this are a great way to surface our different perspectives, especially as Roosevelt undergoes a time of great change thanks to the light rail and increased development. While we aren’t using it this way, Polis has been deployed quite successfully at very large scales in places like Taiwan and Finland to help build consensus across varying opinion groups. In this way, it serves as a potential antidote to the division brought about by today’s social media platforms.
Engagement Stats
The results of this sentiment analysis are still rolling in, but they’ve slowed down enough that I can provide this preliminary report:
- Number of ideas from Rooted in Roosevelt post-it notes: 51
- Email recipients: 612
- Emails opened (by humans): 217 (36%)
- Click-throughs from email: 77 (13%)
- Additional ideas added by Polis users: 17
- Ideas rejected (duplicates or statements that didn’t make sense): 12
- Survey participants: 77
- Individual votes cast: 3,356
While we’ve got some ideas for increasing these response rates for future surveys, it’s fair to say that based on typical email response rates, these are very positive results. They suggest real hunger for this kind of ability to weigh in with one’s opinions about the neighborhood.
Access the Data Yourself
One of the best parts about Polis is that we can easily share the results of the survey directly with you so that you can explore the nuances of the data yourself.
Here is the link to the report: https://pol.is/report/r6bxkhbarprbvmyfzfrmj
It would be great to hear your reflections in the comments below.
P.S.
Oh, and one last thing. I doubt I’ll be updating this report, but if you missed out on responding to the survey and you subscribe to the RNA newsletter, you can look for the invitation in your email.